


Analysis and Visualization of Time Series
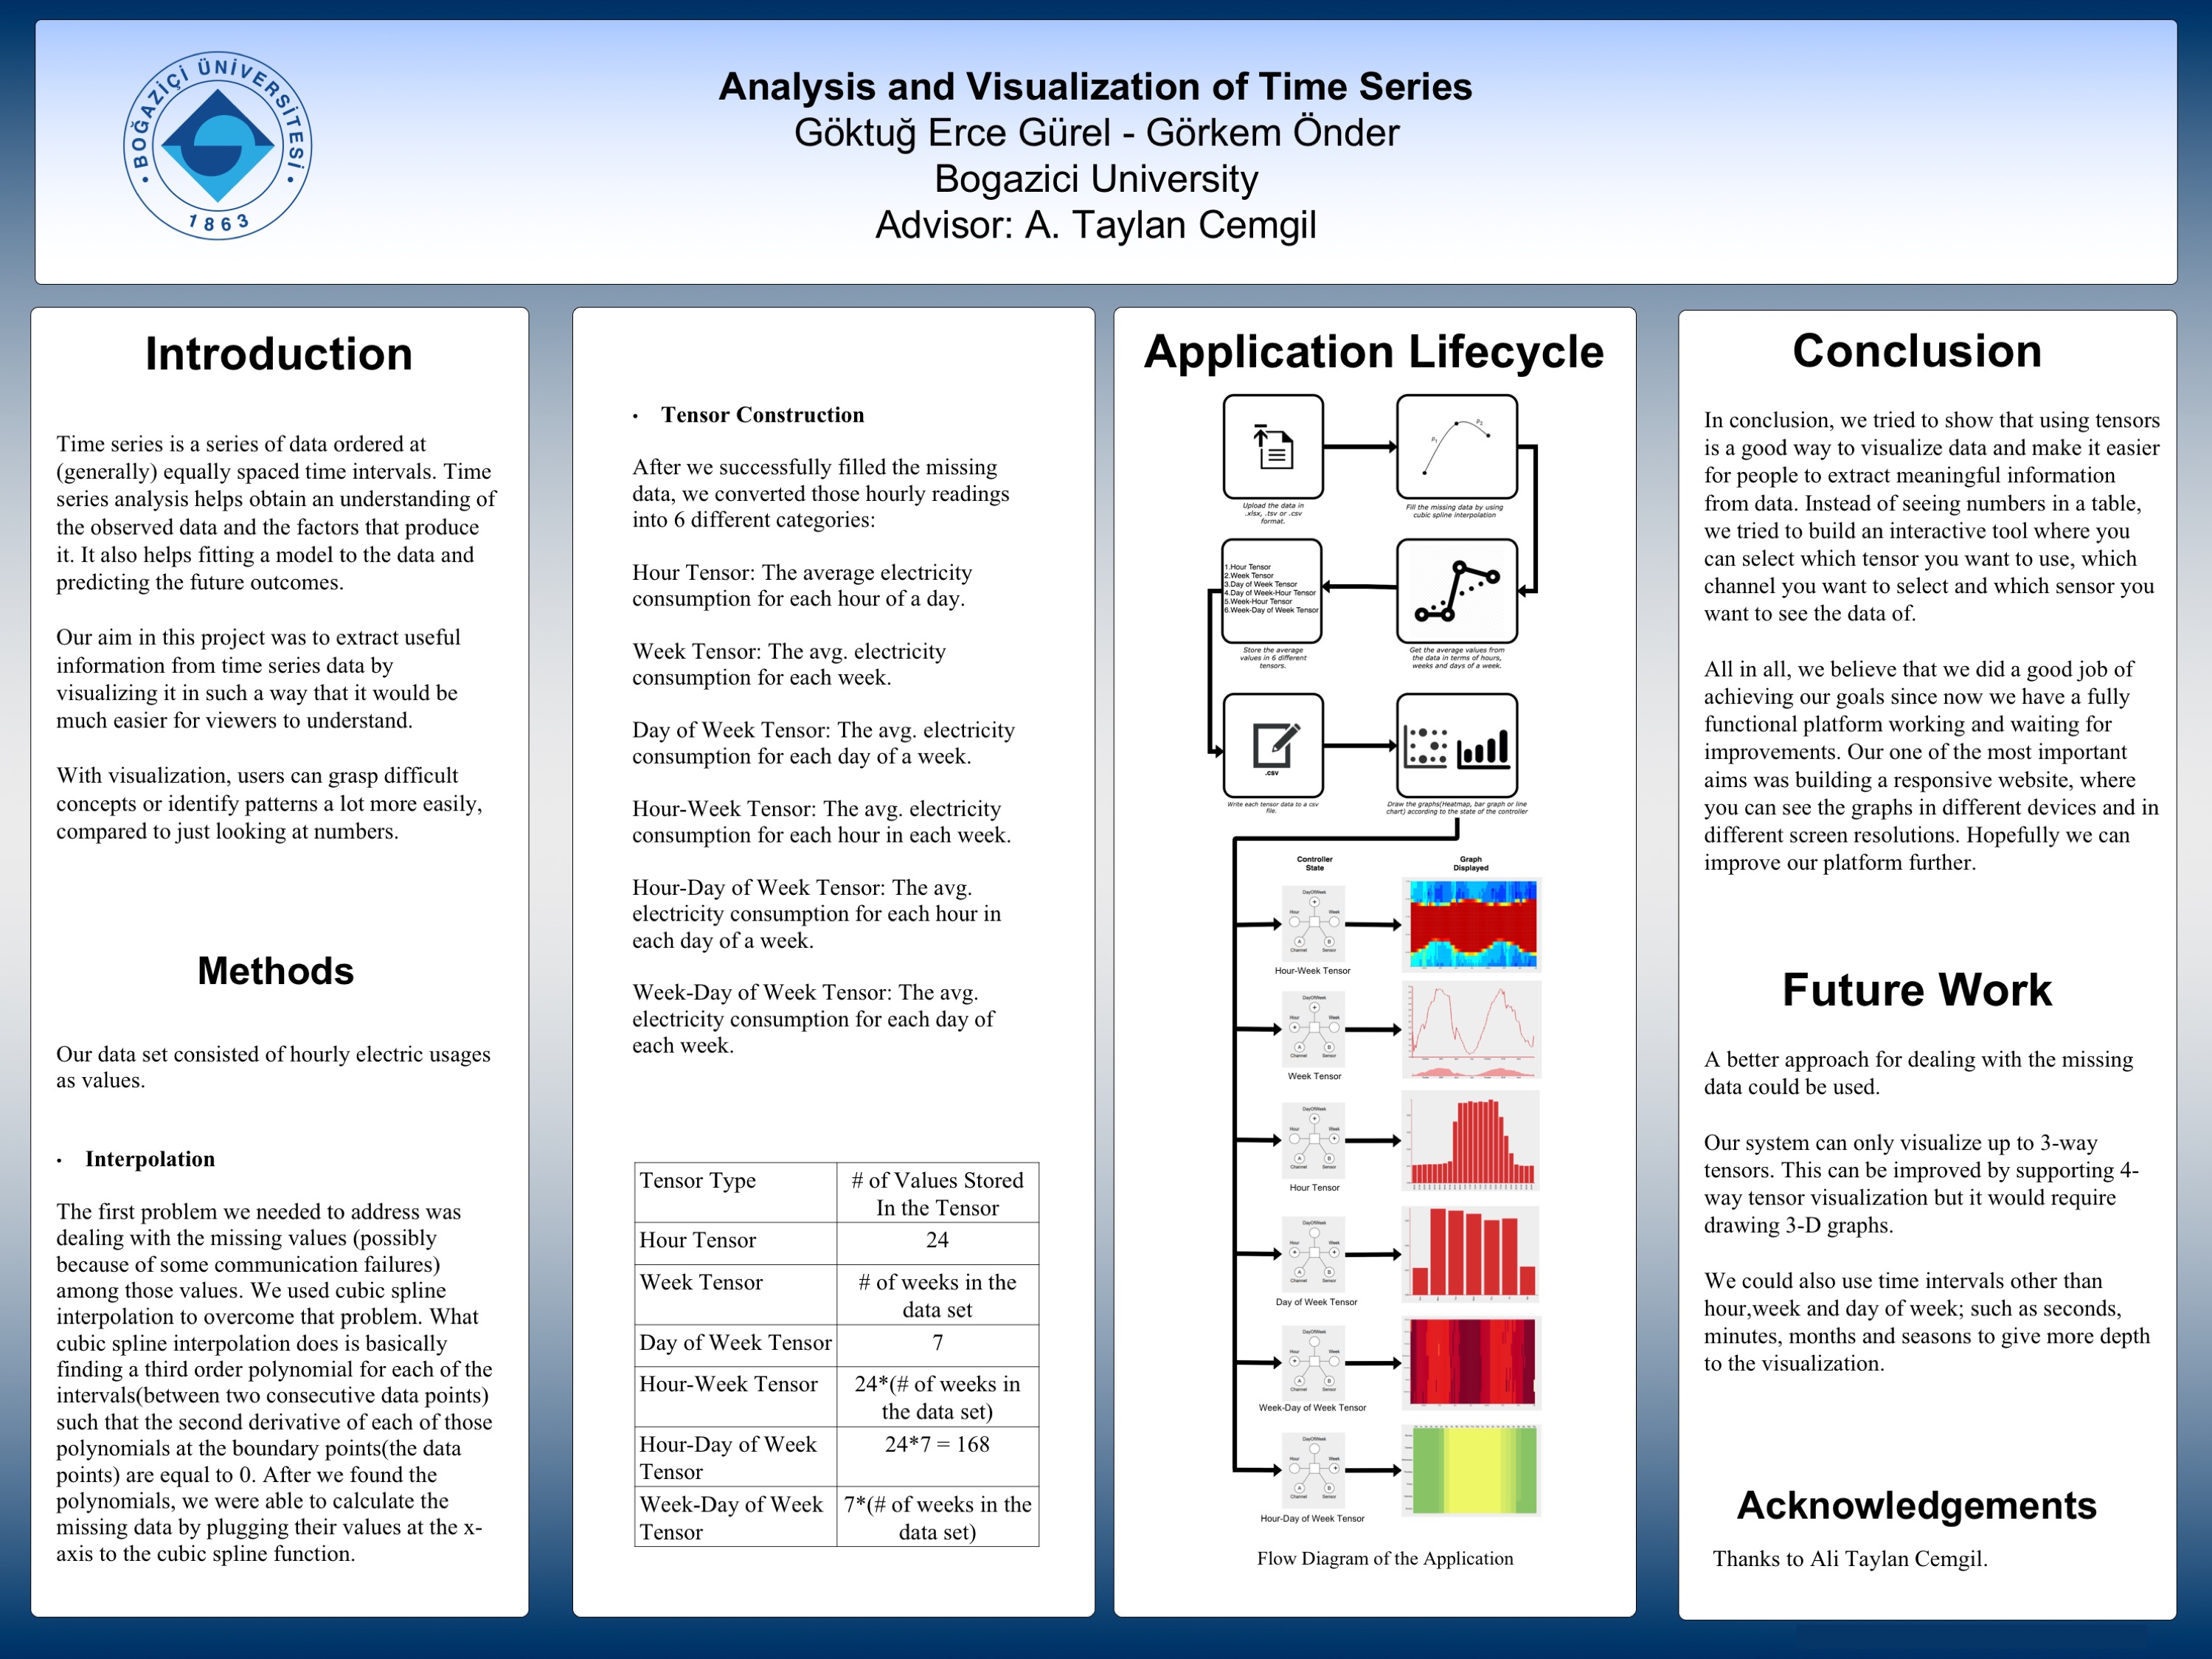
Data visualization and data analysis have become such important topics in our age with the huge boom in produced data. In our project, we wanted to develop an interactive visualization platform for time series data. We used multi-way arrays (also called as tensors) to store time series data in different entities and we used D3.js library to visualize those arrays. We filled missing data in the dataset with cubic spline interpolation. In the responsive platform we built, users can upload their own datasets and choose different tensor combinations for different visualizations.
Project Poster:
Project Members:
Göktuğ Erce Gürel
Görkem Önder
Project Advisor:
Ali Taylan Cemgil
Project Status:
Project Year:
2016
- Fall